
RL · Data science project
Multi-Stock Trading Agent
A reinforcement-learning agent that manages a 10-stock portfolio
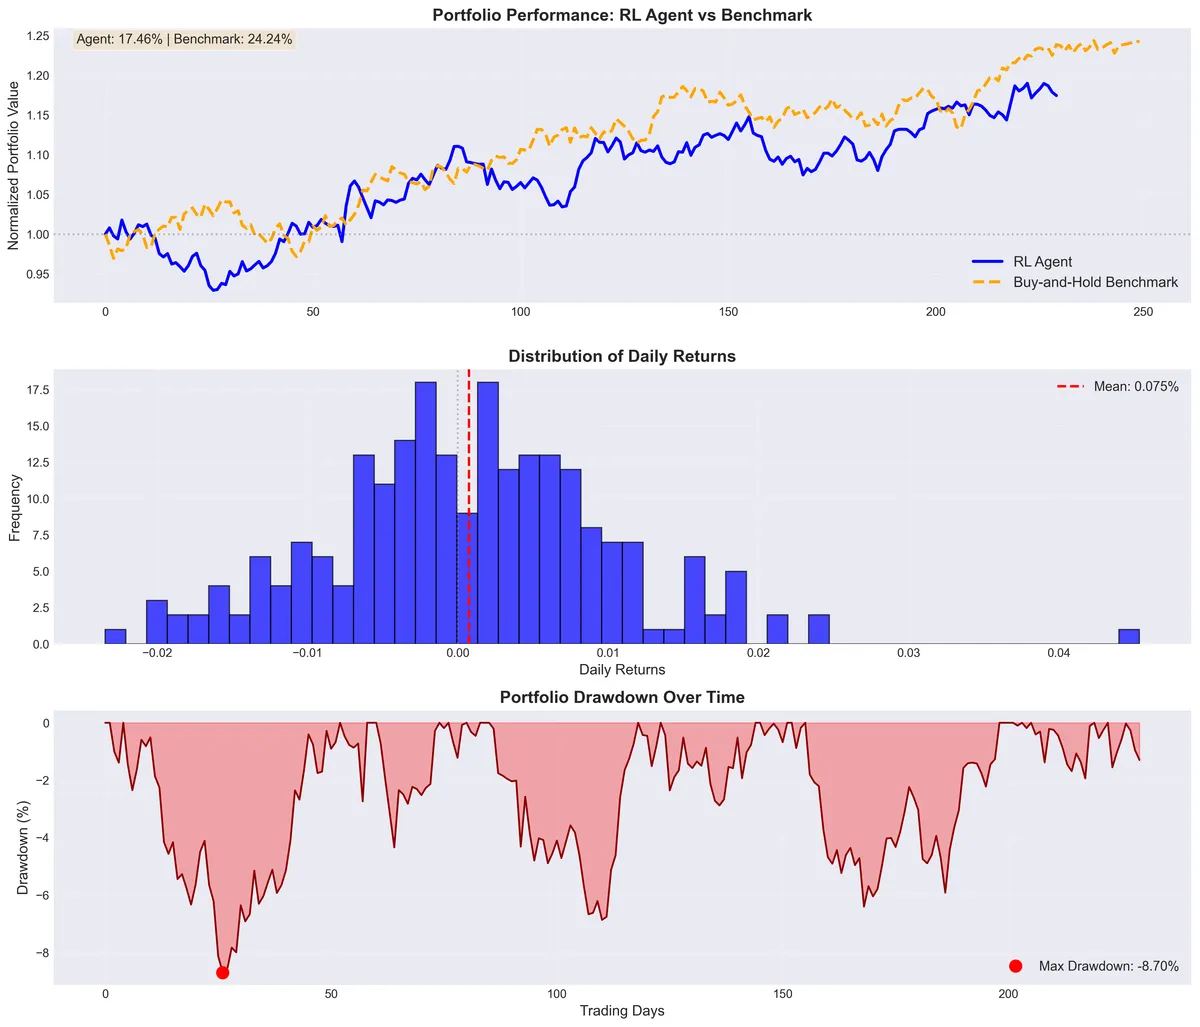
- Agent return, test year
- 17.5%
- Buy-and-hold return
- 24.2%
- Max drawdown
- −8.7%
The problem
Most investors buy and hold, or split money evenly across stocks. This project asks whether an agent can learn to rebalance a 10-stock, 5-sector portfolio from market signals, aiming for the best risk-adjusted return rather than the biggest raw gain. It's hard because rewards arrive late, every decision changes what comes next, and trading costs punish rebalancing too often.
The data
Yahoo Finance daily prices for AAPL, GOOGL, MSFT, JPM, BAC, JNJ, UNH, XOM, WMT and AMZN ↗
Trained on 2018–2023 (about 1,258 trading days), tested on 2023–2024 (about 252 days the agent never saw)
Approach
- Calculated 15 technical indicators per stock (moving averages, RSI, MACD, Bollinger Bands, volatility and returns), 150 in all.
- Built a custom Gymnasium environment with a 162-value state (indicators, current holdings, cash and portfolio value) and 10 continuous actions, one portfolio weight per stock.
- Rewarded the agent on its Sharpe ratio and charged 0.1% per trade.
- Trained a PPO agent with Stable-Baselines3 on 2018–2023, then tested it on unseen 2023–2024 data against an equal-weight buy-and-hold portfolio.
Results
On the unseen test year the agent returned 17.46%, with a maximum drawdown of 8.70%. An equal-weight buy-and-hold portfolio returned 24.24% over the same period, so the agent made money but did not beat the benchmark.
What I'd do next
- Train for much longer: 100,000 to 1 million timesteps instead of the 10,000-step demo setting.
- Add inputs beyond price indicators, such as the VIX, interest rates and news sentiment.
Tools
- Python
- Stable-Baselines3
- Gymnasium
- pandas
- NumPy
- matplotlib
- yfinance